What is the gross rent multiplier? A quick price check for rentals

The gross rent multiplier (GRM) is a rental property's price divided by its gross rent for one year. It tells you how many years of rent, before any expenses, the price represents. A fourplex listed at $600,000 that brings in $60,000 a year in rent and other income has a gross rent multiplier of 10.00.
This page covers the GRM formula, how real estate investors use it to sort listings quickly, a worked example with two fourplexes, how to set a target GRM from nearby sales, what the GRM leaves out and how it compares with cap rate. It is general information and is not legal or tax advice. Rules vary by state and city. Check your local law or an attorney.
What is the gross rent multiplier?
The gross rent multiplier is a ratio between what a rental costs to buy and what it brings in before expenses.
Gross rent multiplier = price / annual gross rent
Annual gross rent is the scheduled rent for every unit for a full year, plus other income such as parking, storage, laundry or pet rent. Nothing comes off it. Vacancy, property taxes, insurance, repairs and the mortgage all stay out. The gross rent entry covers that figure on its own.
A GRM of 10 means the price equals ten years of gross rent. A lower GRM means you pay fewer years of rent for the property, and a higher GRM means you pay more. The same formula, turned around, gives a quick price estimate:
Estimated price = target GRM x annual gross rent
The gross rent multiplier calculator does both: it works out a listing's GRM, the price your target GRM supports and the rent the asking price would need.
How real estate investors use it
The GRM is a quick filter for listings. It needs only two figures that almost every listing shows, the asking price and the rent, so you can run it on a dozen properties in a few minutes. Investors use it to:
- Sort listings. Rank a batch of similar rentals by GRM and look closer at the ones near or below what similar properties sold for.
- Spot an outlier. A GRM far above nearby sales can mean the asking price is high. A GRM far below can mean a bargain, or rents that are not what they seem, or costs the listing does not show.
- Sanity check a price. Multiply the rent by the GRM of recent nearby sales to see roughly where the price should land before you ask for more information.
It works best when you compare like with like: the same property type, a similar age and condition, the same neighborhood and the same arrangement for who pays the utilities.
A worked example: two fourplexes
All the figures here are made up. A real estate investor is looking at two fourplexes in the same part of town.
Fourplex A is listed at $600,000. Its four units rent for $1,200 a month each, $4,800 in all, and coin laundry brings in $200 a month. The tenants pay their own utilities.
Fourplex B is listed at $520,000. Its four units rent for $4,500 a month together, and storage lockers bring in $100 a month. It is an older building and the owner pays water, sewer and heat.
Step one is the gross rent multiplier:
| Fourplex A | Fourplex B | |
|---|---|---|
| Monthly gross rent | $4,800 + $200 = $5,000 | $4,500 + $100 = $4,600 |
| Annual gross rent | $5,000 x 12 = $60,000 | $4,600 x 12 = $55,200 |
| GRM | $600,000 / $60,000 = 10.00 | $520,000 / $55,200 = 9.42 |
| Gross yield | $60,000 / $600,000 = 10.00 percent | $55,200 / $520,000 = 10.62 percent |
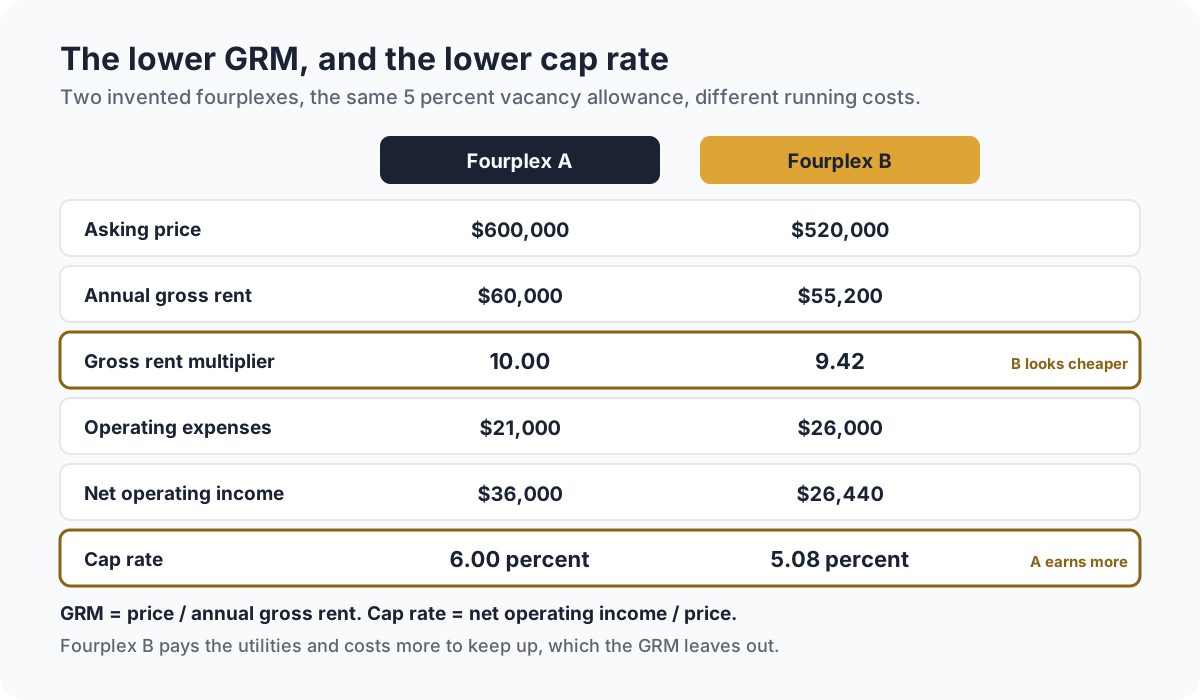
On the GRM alone, Fourplex B looks cheaper. If similar fourplexes nearby sold at about 10 times their gross rent, Fourplex B's rent supports a price of 10 x $55,200 = $552,000, which is $32,000 more than its asking price. Fourplex A's rent supports 10 x $60,000 = $600,000, its asking price exactly.
Step two adds what the GRM leaves out. Each building gets a 5 percent vacancy allowance, and the investor estimates the operating expenses from the seller's records: $21,000 a year for Fourplex A and $26,000 for Fourplex B, which carries the utility bills and more repairs.
| Fourplex A | Fourplex B | |
|---|---|---|
| Vacancy at 5 percent | $60,000 x 0.05 = $3,000 | $55,200 x 0.05 = $2,760 |
| Rent after vacancy | $57,000 | $52,440 |
| Operating expenses | $21,000 | $26,000 |
| Net operating income | $57,000 minus $21,000 = $36,000 | $52,440 minus $26,000 = $26,440 |
| Cap rate | $36,000 / $600,000 = 6.00 percent | $26,440 / $520,000 = 5.08 percent |
The building with the lower GRM has the lower cap rate. For Fourplex B to earn the same 6.00 percent cap rate as Fourplex A, its price would have to be $26,440 / 0.06 = $440,666.67. The GRM pointed the investor toward the wrong building because the running costs were left out.
Setting a target GRM from nearby sales
A GRM means little on its own. It becomes useful next to the GRMs of rentals like yours that sold recently nearby. Divide each sale price by that property's annual gross rent:
| Sale | Price | Monthly rent | Annual gross rent | GRM |
|---|---|---|---|---|
| Sale 1 | $627,000 | $4,750 | $57,000 | 11.00 |
| Sale 2 | $570,000 | $5,000 | $60,000 | 9.50 |
| Sale 3 | $576,000 | $4,800 | $57,600 | 10.00 |
The middle figure, 10.00, is a fair target for the two fourplexes above. The rental comps guide covers finding similar rentals and their rents, and a local agent or appraiser can help you find sales with known rents. Use annual rent in every row: a GRM on monthly rent is twelve times larger, so Fourplex A would read $600,000 / $5,000 = 120.00.
What the GRM leaves out
The GRM is fast because it ignores most of what decides whether a rental makes money:
- Vacancy. A building with frequent turnover collects less than its gross rent. The vacancy rate entry shows how to measure it.
- Operating expenses. Property taxes, insurance, repairs, owner-paid utilities and management can differ widely between two buildings with the same rent. The operating expenses entry lists what counts.
- Financing. The GRM says nothing about the loan, the down payment or the monthly payment.
- Condition and capital needs. A roof or furnace near the end of its life does not show in the rent.
- Whether the rent is real. A listing's rent can be a projection, or include units let below or above the going rate. Check it against a rent roll and the bank deposits behind it.
That is why the GRM is a first pass. A property that passes the GRM check still needs a cap rate, a cash flow estimate and a look at the seller's records before you make an offer.
GRM and cap rate
Both measures compare price with income, and they look at different income figures.
| Gross rent multiplier | Cap rate | |
|---|---|---|
| Formula | Price / annual gross rent | Net operating income / price |
| Income used | Rent and other income, before anything comes off | Rent after vacancy and operating expenses |
| Better for a buyer | Lower | Higher |
| Figures needed | Price and rent | Price, rent, vacancy and every operating expense |
| Best use | Sorting many listings quickly | Judging one property closely |
The cap rate needs net operating income, which takes more work to build, and in return it accounts for the running costs. The cap rate guide explains it in full, and the cap rate calculator works it out from your own figures. Once you have the expenses, a pro forma carries both numbers forward into a projection of cash flow over several years.
Frequently asked questions
How do you calculate the gross rent multiplier?
Divide the price by the annual gross rent: the scheduled rent for every unit for a year plus other income, before vacancy and expenses. A fourplex at $600,000 with $60,000 of annual gross rent has a GRM of $600,000 / $60,000 = 10.00.
What is a good gross rent multiplier?
There is no single good figure. It depends on the market, the property type and the time. Compare a listing with the GRMs of similar rentals that sold nearby recently, and treat a lower GRM as better for a buyer only when the properties cost about the same to run.
Is the gross rent multiplier based on monthly or annual rent?
Most investors use annual rent. Some use monthly rent, which gives a figure twelve times larger. Check which one a listing or report means before you compare numbers.
Why can a lower GRM be the worse deal?
Because the GRM ignores vacancy and operating expenses. In the example, Fourplex B has a GRM of 9.42 and a cap rate of 5.08 percent, while Fourplex A has a GRM of 10.00 and a cap rate of 6.00 percent, because Fourplex B pays the utilities and costs more to keep up.
What is the difference between GRM and gross yield?
Gross yield is the GRM turned over: annual gross rent divided by the price, shown as a percentage. A GRM of 10.00 is a gross yield of 10.00 percent, and the rental yield calculator works out both gross and net yield.
Check what a rental really brings in
A GRM is only as good as the rent behind it, and the rent you actually collect is the figure to trust once you own the property. In KeyRing, you connect your bank accounts securely through Plaid, and each transaction is matched to a property with suggestions you confirm. Income and expense records use categories you can edit, and you can export your transactions to Excel. See what KeyRing does or how plans are priced.
Free calculators and templates
- Gross rent multiplier calculatorPrice over a year of gross rent, and the price your target GRM supports.
- Rental yield calculatorGross and net yield: a year of rent as a share of the price.
- Rental property calculatorCash flow, cap rate, cash on cash return and ROI for one property, all at once.
Browse all rental property calculators, free templates and the glossary.
From the blog
- What is cap rate? How to calculate it for a rental propertyCap rate is net operating income divided by a property's price or value. How to calculate it, a worked fourplex example and what it leaves out.
- What is NOI? Net operating income for rental propertyNOI is a rental property's income after vacancy and operating expenses, before the mortgage. What goes in, what stays out, a duplex example and its uses.
- Rental comps: how to find comparable rentals and set your rentRental comps are similar rentals nearby that show what your unit can charge. How to find good comps, compare them per square foot and set a rent.