What is vacancy rate? Physical and economic vacancy for rentals

A vacancy rate is the share of a rental property's available time that its units sat empty over a period, usually a year. Count the days each unit was vacant, divide by the number of units times the days in the period, and the result is the physical vacancy rate. Its complement is the occupancy rate. A fourplex whose units sat empty for 73 of 1,460 unit-days in a year has a vacancy rate of 5.00 percent, and with a concession and some unpaid rent its economic vacancy rate is 6.67 percent.
This page covers how physical and economic vacancy are measured, how the occupancy rate relates to them, a worked fourplex example, how investors use a vacancy allowance in a pro forma and in NOI, why one empty unit weighs so much in a small portfolio and the general ways owners keep vacancy down. It is general information and is not legal or tax advice. Rules vary by state and city. Check your local law or an attorney.
What is vacancy rate?
Every unit in a property could, in principle, be let on every day of the year. That capacity is the number of units times the days in the period, counted in unit-days (or in unit-months, if you prefer to work by month). The vacancy rate is the part of that capacity that went unlet.
Physical vacancy rate = vacant unit-days / (number of units x days in the period)
Occupancy rate = 100 percent minus the vacancy rate
A rate for a period is different from a snapshot. A rent roll taken on one date shows which units are empty today, and one empty unit out of four reads as 25 percent on that date even when the unit was let for most of the year. For budgets and deal analysis, the rate over a full period is the more useful figure.
Physical vacancy and economic vacancy
Physical vacancy counts time. It answers the question of how long units sat empty, whatever the rent on them.
Economic vacancy counts money. It adds everything that kept rent from arriving, as a share of gross potential rent: the rent lost while units sat empty, rent given up through concessions such as a free month, and rent that was billed and never collected.
Economic vacancy rate = (rent lost to vacancy + concessions + unpaid rent) / gross potential rent
Gross potential rent is the rent every unit would bring if it were let for every day of the period at its scheduled rent. The two rates match only when nothing was lost on occupied units. When an owner offers a rent concession to fill a unit, physical vacancy goes down and economic vacancy may barely move, which is why many investors track both.
A worked example: a fourplex over one year
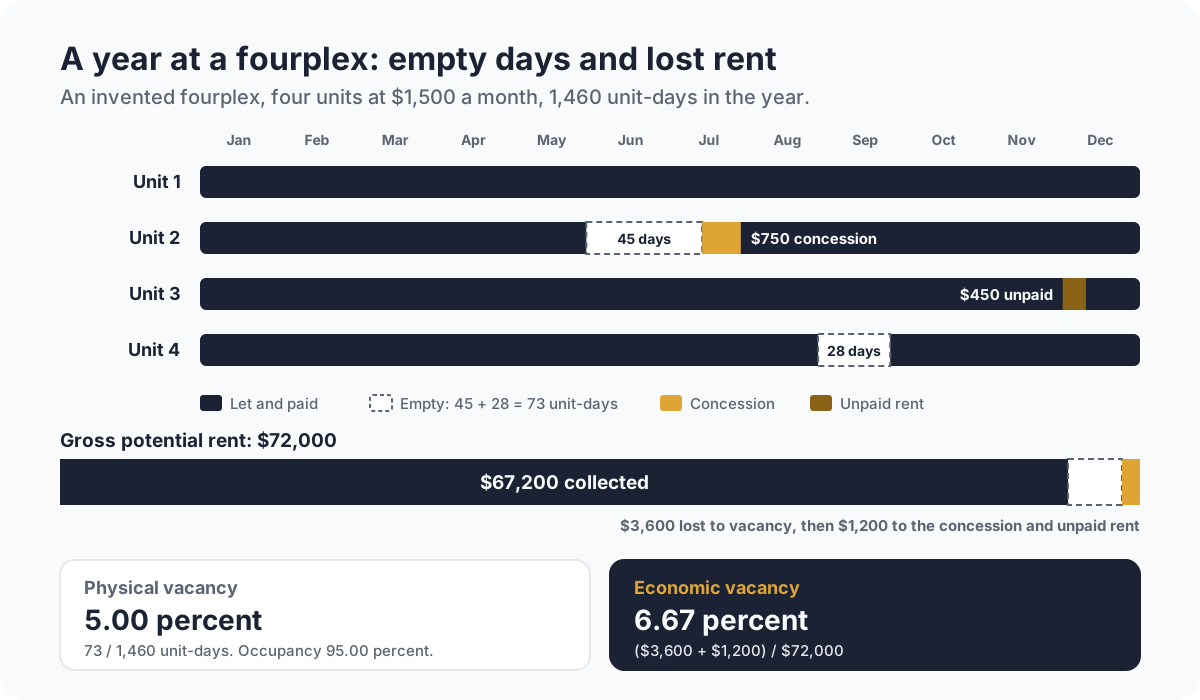
All the figures here are made up. A real estate investor owns a fourplex with four units at $1,500 a month each. Over the year:
- Unit 2 turned over once and sat empty for 45 days. The new tenant received half a month free, a $750 concession.
- Unit 4 turned over once and sat empty for 28 days.
- The tenant in Unit 3 left $450 of rent unpaid, which the owner wrote off.
- Units 1 and 3 were let all year, and every unit is let today.
The vacancy math, worked the same way as the vacancy rate calculator:
- Unit-days in the year: 4 x 365 = 1,460
- Vacant unit-days: 45 + 28 = 73
- Physical vacancy rate: 73 / 1,460 = 5.00 percent, so the occupancy rate is 95.00 percent
- Gross potential rent: $1,500 x 12 x 4 = $72,000
- Rent lost to vacancy: $72,000 x 5 percent = $3,600
- Other rent lost on occupied units: $750 + $450 = $1,200
- Economic vacancy rate: ($3,600 + $1,200) / $72,000 = 6.67 percent
- Rent collected: $72,000 minus $3,600 minus $1,200 = $67,200
The calculator prices a day of rent at the monthly rent x 12 / 365, which for these units is about $49.32 a day. Counted in months, 73 days is 2.4 unit-months out of 48, which is the same 5.00 percent, and 2.4 x $1,500 is the same $3,600. Enter 4 units, 73 vacant days, 365 days, $1,500 of rent, $1,200 of other rent lost and 0 units vacant today, and the calculator returns 5.00 percent, $3,600.00 and 6.67 percent.
Vacancy in a pro forma and in NOI
A pro forma projects a property's income before you buy it or plan its year. It starts with gross potential rent and subtracts a vacancy allowance, often written as a percentage, to reach the rent you expect to collect. Other income is added, operating expenses are subtracted, and the result is net operating income. The NOI guide walks through each line.
Vacancy comes straight off the top, so every dollar of it lowers NOI by one dollar. Suppose the fourplex owner budgeted a 5 percent allowance, $3,600, and invented operating expenses of $24,000:
- Budgeted NOI: $72,000 minus $3,600 minus $24,000 = $44,400
- Actual NOI: $67,200 minus $24,000 = $43,200
The physical vacancy matched the budget exactly. The $1,200 gap came from the concession and the unpaid rent, which a physical vacancy figure alone would miss. Many investors set the allowance from the economic rate for that reason, or carry a separate line for credit loss.
Where should the allowance come from? Use your own history first: a year or two of rent records for the same property tells you how long turnovers really take. For a property you are buying, ask the seller for the rent roll and a trailing twelve months of income, and compare with similar rentals nearby. The rental cash flow calculator and the rental yield calculator both take a vacancy rate, so the figure you settle on carries through to cash flow and yield.
Why one empty unit weighs so much in a small portfolio
In a large building, one turnover is a small share of the year. In a small portfolio, it can be most of the year's vacancy.
Take a unit that sits empty for three months:
- In the fourplex, that is 3 of 48 unit-months, a vacancy rate of 6.25 percent, and $4,500 of lost rent.
- In a building of 20 units at the same rent, the same three months is 3 of 240 unit-months, 1.25 percent.
- For an owner of a single-family rental, it is 3 of 12 months, 25 percent of that year's rent.
The dollar loss is the same $4,500 in every case. What changes is how much of the year's income it represents, and whether the remaining units can absorb it. A small owner's mortgage, taxes and insurance stay the same while the unit is empty, so a vacancy allowance that looks generous on paper may be thin in practice. Some owners of one or two units budget for one turnover's worth of empty time each year, which reads as a higher percentage than a large building would use.
Ways owners reduce vacancy
Vacancy is partly the market and partly how a property is run. Owners generally work on three things.
- Renewals. A tenant who stays has no empty days at all. Starting the renewal conversation well before the lease ends, keeping up with maintenance requests and setting renewal increases with the local market in mind all help.
- Turnover speed. Each empty day costs the daily rent, about $49.32 for the fourplex units. Cutting Unit 2's 45-day turnover to 30 days would have kept 15 more days of rent: $1,500 x 12 / 365 x 15 = $739.73. Scheduling cleaning, painting and repairs before the move-out date, and listing the unit as soon as notice arrives, shortens the gap.
- Pricing. A unit priced above what similar rentals nearby ask tends to sit longer. Holding out an extra month for $50 more a month gives up $1,500 to earn $600 a year, so it takes two and a half years to come out ahead.
Track every unit month by month so you see vacancy as it happens. A simple rent tracker with one row per unit and one column per month shows which months were empty, and those records become next year's allowance.
Frequently asked questions
How do you calculate a vacancy rate?
Add up the days each unit sat empty in the period and divide by the number of units times the days in the period. In the fourplex example, 73 empty days out of 4 x 365 = 1,460 unit-days is a vacancy rate of 5.00 percent.
What is the difference between physical and economic vacancy?
Physical vacancy counts the time units sat empty. Economic vacancy counts the rent lost, including concessions and unpaid rent on occupied units, as a share of gross potential rent. The fourplex had a physical rate of 5.00 percent and an economic rate of 6.67 percent.
How does occupancy rate relate to vacancy rate?
Occupancy is the complement of vacancy for the same period: 100 percent minus the vacancy rate. A property with a 5.00 percent vacancy rate for the year was 95.00 percent occupied.
What vacancy rate should I use in a pro forma?
Start from your own records for the property and from rentals like it nearby. Owners of one or a few units often budget for at least one turnover's worth of empty time each year, and economic vacancy is the safer basis when concessions or unpaid rent have come up before.
Does vacancy affect NOI?
Yes. Vacancy reduces the rent collected, which is the top line of net operating income, so every dollar lost to vacancy lowers NOI by one dollar. In the example, the $1,200 of concessions and unpaid rent took NOI from a budgeted $44,400 to $43,200.
See each property's rent and empty months
Vacancy is easier to measure when every rent payment is already recorded against its property. In KeyRing, you connect your bank accounts securely through Plaid, and each transaction is matched to a property with suggestions you confirm. Income and expense records use categories you can edit, and you can export your transactions to Excel. See what KeyRing does or how plans are priced.
Free calculators and templates
- Vacancy rate calculatorThe share of the time units sat empty, and the rent it cost.
- Rental cash flow calculatorMonthly cash flow line by line, per unit, with the break-even rent.
- Rental yield calculatorGross and net yield: a year of rent as a share of the price.
- Rent tracker templateEvery unit on one row and every month in a column, so a year of rent fits on one page.
Browse all rental property calculators, free templates and the glossary.
From the blog
- What is NOI? Net operating income for rental propertyNOI is a rental property's income after vacancy and operating expenses, before the mortgage. What goes in, what stays out, a duplex example and its uses.
- What is a rent concession? Types, examples and how to record themA rent concession is a discount, such as a free month, to sign or renew a lease. See the common types, how to work out net effective rent and how to record one.
- What is a rent roll (with a free template)A rent roll lists each unit, tenant, lease and rent in a property as of one date. See what it includes, a fourplex example and the numbers you can pull from it.