What is occupancy rate? Physical and economic occupancy for rentals

An occupancy rate is the share of a rental property's available time that its units were let over a period, usually a year. Count the unit-months each unit had a tenant, divide by the number of units times the months in the period, and the result is the physical occupancy rate. A small portfolio of five units that was let for 57 of its 60 unit-months in a year has an occupancy rate of 95.00 percent, and once a concession and some unpaid rent are counted, its economic occupancy rate is 93.75 percent.
This page covers how physical and economic occupancy are measured, how occupancy on one date differs from occupancy over a year, a worked example for a small portfolio, how investors and lenders read the figure and why a full building is not always the most profitable one. It is general information and is not legal or tax advice. Rules vary by state and city. Check your local law or an attorney.
What is occupancy rate?
Every unit in a property could, in principle, have a tenant in every month of the year. That capacity is the number of units times the months in the period, counted in unit-months (or in unit-days, if you track by the day). The occupancy rate is the part of that capacity that was let.
Physical occupancy rate = occupied unit-months / (number of units x months in the period)
Economic occupancy rate = rent collected / gross scheduled rent
Occupancy is the mirror image of vacancy. For the same period, the occupancy rate is 100 percent minus the vacancy rate, so a property with a 5 percent vacancy rate was 95 percent occupied. This entry looks at the let side, the figure owners and buyers tend to quote when they describe how a property is doing.
You can work it out by hand, or use the vacancy rate calculator, which returns the occupancy rate beside the vacancy rate.
Physical occupancy and economic occupancy
Physical occupancy counts time. It answers how much of the year the units had tenants in them, whatever those tenants paid.
Economic occupancy counts money. It compares the rent that actually arrived with the rent the property was scheduled to bring in if every unit were let all year at its scheduled rent. That scheduled figure is often called gross scheduled rent or gross potential rent, and the gross rent entry explains the term.
The two rates match only when every occupied unit paid its full scheduled rent. They drift apart for three common reasons:
- Concessions. A free month or a discount to fill a unit keeps physical occupancy up while the rent collected goes down. The rent concession guide covers how owners use them.
- Unpaid rent. A tenant who stays but falls behind counts as occupied, and the rent written off lowers economic occupancy.
- Below-schedule rent. A unit let to a family member or a long-term tenant at less than the scheduled rent is fully occupied and still collects less.
Physical occupancy tells you whether people want to live in the property. Economic occupancy tells you whether it is earning what you planned.
Occupancy on a date and occupancy over a period
A rent roll taken on one date shows which units have tenants today. One empty unit out of five reads as 80 percent occupied on that date, even when that unit was let for most of the year.
For budgets, deal analysis and comparing one year with another, the rate over a full period is the steadier figure. It counts each turnover for as long as it lasted, so one empty month on the last day of the year weighs the same as one empty month in June.
A worked example: a small portfolio over one year
All the figures here are made up. A real estate investor owns five rental units: a single-family house and two duplexes. Each unit is scheduled to rent for $1,400 a month. Over the year:
- The house sat empty in January and February, 2 unit-months. The new tenant received half a month free, a $700 concession.
- Unit B of the first duplex sat empty for December, 1 unit-month, and is still empty today.
- The tenant in Unit A of the second duplex left $350 of rent unpaid, which the owner wrote off.
- Every other unit was let all year.
The physical occupancy math:
- Unit-months in the year: 5 x 12 = 60
- Vacant unit-months: 2 + 1 = 3
- Occupied unit-months: 60 minus 3 = 57
- Physical occupancy rate: 57 / 60 = 95.00 percent, so the vacancy rate is 5.00 percent
The economic occupancy math:
- Gross scheduled rent: $1,400 x 12 x 5 = $84,000
- Rent lost to empty months: 3 x $1,400 = $4,200
- Rent lost on occupied units: $700 + $350 = $1,050
- Rent collected: $84,000 minus $4,200 minus $1,050 = $78,750
- Economic occupancy rate: $78,750 / $84,000 = 93.75 percent
On the last day of the year, one of the five units is empty, so the snapshot reads 4 / 5 = 80 percent occupied, well below the year's 95.00 percent.
The calculator counts in days, so the same year is 5 x 365 = 1,825 unit-days, and 3 unit-months is 3 x 365 / 12 = 91.25 days. Enter 5 units, 91.25 vacant days, 365 days, $1,400 of rent, $1,050 of other rent lost and 1 unit vacant today, and it returns a vacancy rate of 5.00 percent, an occupancy rate of 95.00 percent, $4,200.00 of rent lost to vacancy and an economic vacancy rate of 6.25 percent. Economic occupancy is 100 percent minus 6.25 percent, the same 93.75 percent.
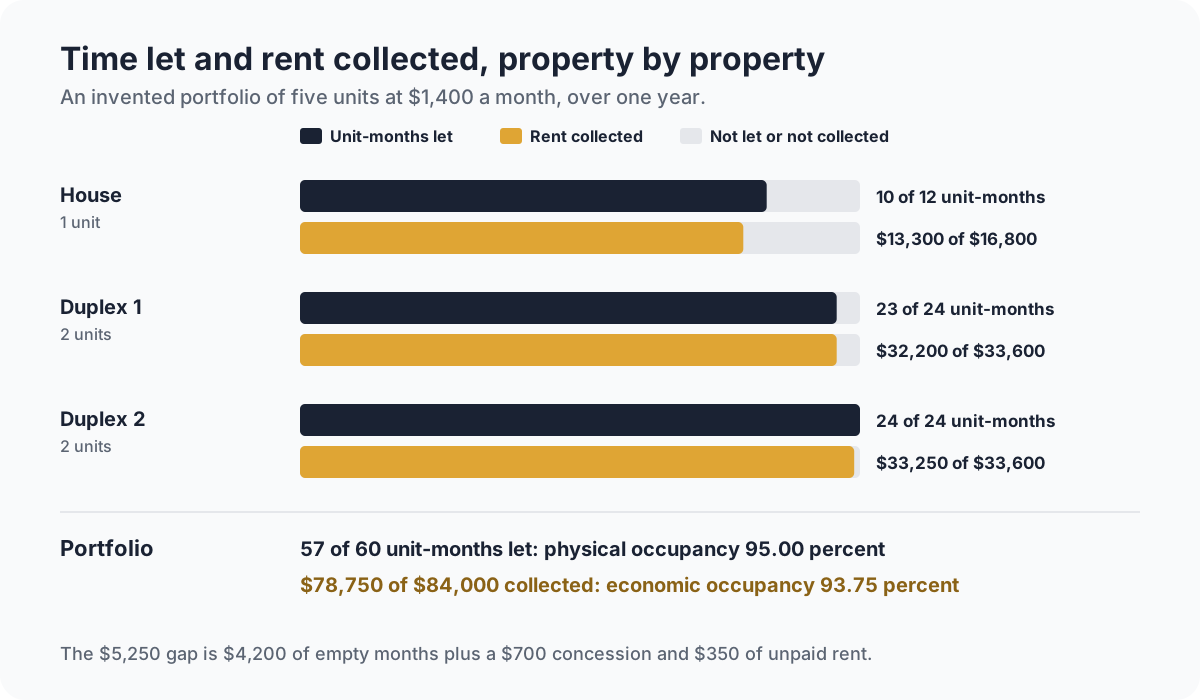
Property by property
The portfolio rate can hide a weak property. Broken out:
| Property | Unit-months let | Physical occupancy | Rent collected | Economic occupancy |
|---|---|---|---|---|
| House | 10 of 12 | 83.33 percent | $13,300 of $16,800 | 79.17 percent |
| Duplex 1 | 23 of 24 | 95.83 percent | $32,200 of $33,600 | 95.83 percent |
| Duplex 2 | 24 of 24 | 100 percent | $33,250 of $33,600 | 98.96 percent |
| Portfolio | 57 of 60 | 95.00 percent | $78,750 of $84,000 | 93.75 percent |
The house carried two-thirds of the year's empty time and the concession, so its economic occupancy is the lowest. The second duplex was full all year and still fell short of 100 percent economic occupancy because of the unpaid rent. A rent tracker with one row per unit and one column per month makes this breakdown quick to build.
How investors and lenders use occupancy
In a pro forma. A pro forma projects a property's income for the year ahead. It starts with gross scheduled rent and takes off an allowance for vacancy and credit loss, which is the same as assuming an economic occupancy rate. Assuming 95 percent economic occupancy on the portfolio above means planning on $84,000 x 95 percent = $79,800 of rent. The year came in at $78,750, $1,050 short, which is exactly the concession and the unpaid rent.
In NOI. Rent collected is the top line of net operating income, so every point of economic occupancy flows straight through. On this portfolio, one percentage point of economic occupancy is $840 of rent a year, and so $840 of NOI. The NOI guide walks through the rest of the calculation, and the rental cash flow calculator carries the same assumption through to monthly cash flow.
When buying. A seller's listing may quote occupancy on the day the rent roll was printed. Ask for the rent roll and a trailing twelve months statement and work out both rates for the full year yourself. A building that is full today after a run of concessions can show strong physical occupancy and weaker economic occupancy.
Is a full building always the goal?
High occupancy is good, and still not the whole story. An owner can keep every unit full by pricing below the market, and that has a cost too.
Leave the concession and the unpaid rent aside, and compare two ways the portfolio owner could have run the year:
- Price every unit $100 below the market, at $1,300, and keep all five full: $1,300 x 60 = $78,000.
- Price at $1,400 and accept the three empty months: $1,400 x 57 = $79,800.
The full portfolio, at 100 percent occupancy, collects $1,800 less than the one at 95.00 percent. The underpricing costs $100 x 60 = $6,000 a year, more than the $4,200 that the three empty months cost. The reverse also holds: holding a unit empty for an extra month to win $50 more a month gives up $1,400 to earn $600 a year.
The aim is the best rent collected over the year, and economic occupancy is the rate that measures it. Owners generally work on renewals, faster turnovers and pricing close to what similar rentals nearby ask. In a single-family rental, one empty month alone takes the year to 11 of 12 unit-months, an occupancy rate of 91.67 percent.
Frequently asked questions
How do you calculate an occupancy rate?
Divide the occupied unit-months (or unit-days) in the period by the number of units times the months (or days) in the period. In the example, 57 occupied unit-months out of 5 x 12 = 60 is an occupancy rate of 95.00 percent.
What is the difference between physical and economic occupancy?
Physical occupancy counts the time units had tenants. Economic occupancy counts the rent collected as a share of gross scheduled rent, so concessions, unpaid rent and below-schedule rents lower it. The example portfolio was 95.00 percent physically occupied and 93.75 percent economically occupied.
How does occupancy rate relate to vacancy rate?
They are complements for the same period and the same basis: occupancy is 100 percent minus vacancy. A property with a 5.00 percent physical vacancy rate for the year was 95.00 percent occupied. The same holds for the economic rates.
Is a 100 percent occupancy rate good?
It means every unit was let for the whole period, which keeps rent coming in. If it comes from pricing well below the market, the rent given up can be more than a few empty months would cost, so compare the rent collected under each approach.
Why does the occupancy on my rent roll differ from my yearly rate?
A rent roll shows the units let on one date. The yearly rate counts every month of the period. In the example, one empty unit on the last day of the year makes the snapshot 80 percent, while the full year was 95.00 percent occupied.
See which units were let each month
Occupancy is easier to measure when every rent payment is already recorded against its property. In KeyRing, you connect your bank accounts securely through Plaid, and each transaction is matched to a property with suggestions you confirm. Income and expense records use categories you can edit, and you can export your transactions to Excel. See what KeyRing does or how plans are priced.
Free calculators and templates
- Vacancy rate calculatorThe share of the time units sat empty, and the rent it cost.
- Rental cash flow calculatorMonthly cash flow line by line, per unit, with the break-even rent.
- Rental yield calculatorGross and net yield: a year of rent as a share of the price.
- Rent tracker templateEvery unit on one row and every month in a column, so a year of rent fits on one page.
Browse all rental property calculators, free templates and the glossary.
From the blog
- What is a rent roll (with a free template)A rent roll lists each unit, tenant, lease and rent in a property as of one date. See what it includes, a fourplex example and the numbers you can pull from it.
- What is a rent concession? Types, examples and how to record themA rent concession is a discount, such as a free month, to sign or renew a lease. See the common types, how to work out net effective rent and how to record one.
- What is a T12 statement? How to build a trailing 12-month operating statementA T12 shows a rental property's income and expenses for each of the last 12 months and the NOI they add up to. What goes on one, how to build it and an example.